hydrationGUI
Note
PyQt5 is required to use this GUI. This can lead to some cross-platform problems. You may need to uninstall and re-install PyQt5 specifying version 5.14 (pip install PyQt5==5.14). If this does not fix the problem, please report the issue using the Github issues tracker.
The hydrationGUI is currently designed to only work with the results of UCSB routines such as "rb_dnp1" used at the CNSI facility.
To start the hydrationGUI type the command:
> hydrationGUI
Opening hydrationGUI
Processing a single topspin data folder, either a 1D spectrum or 2D inversion recovery
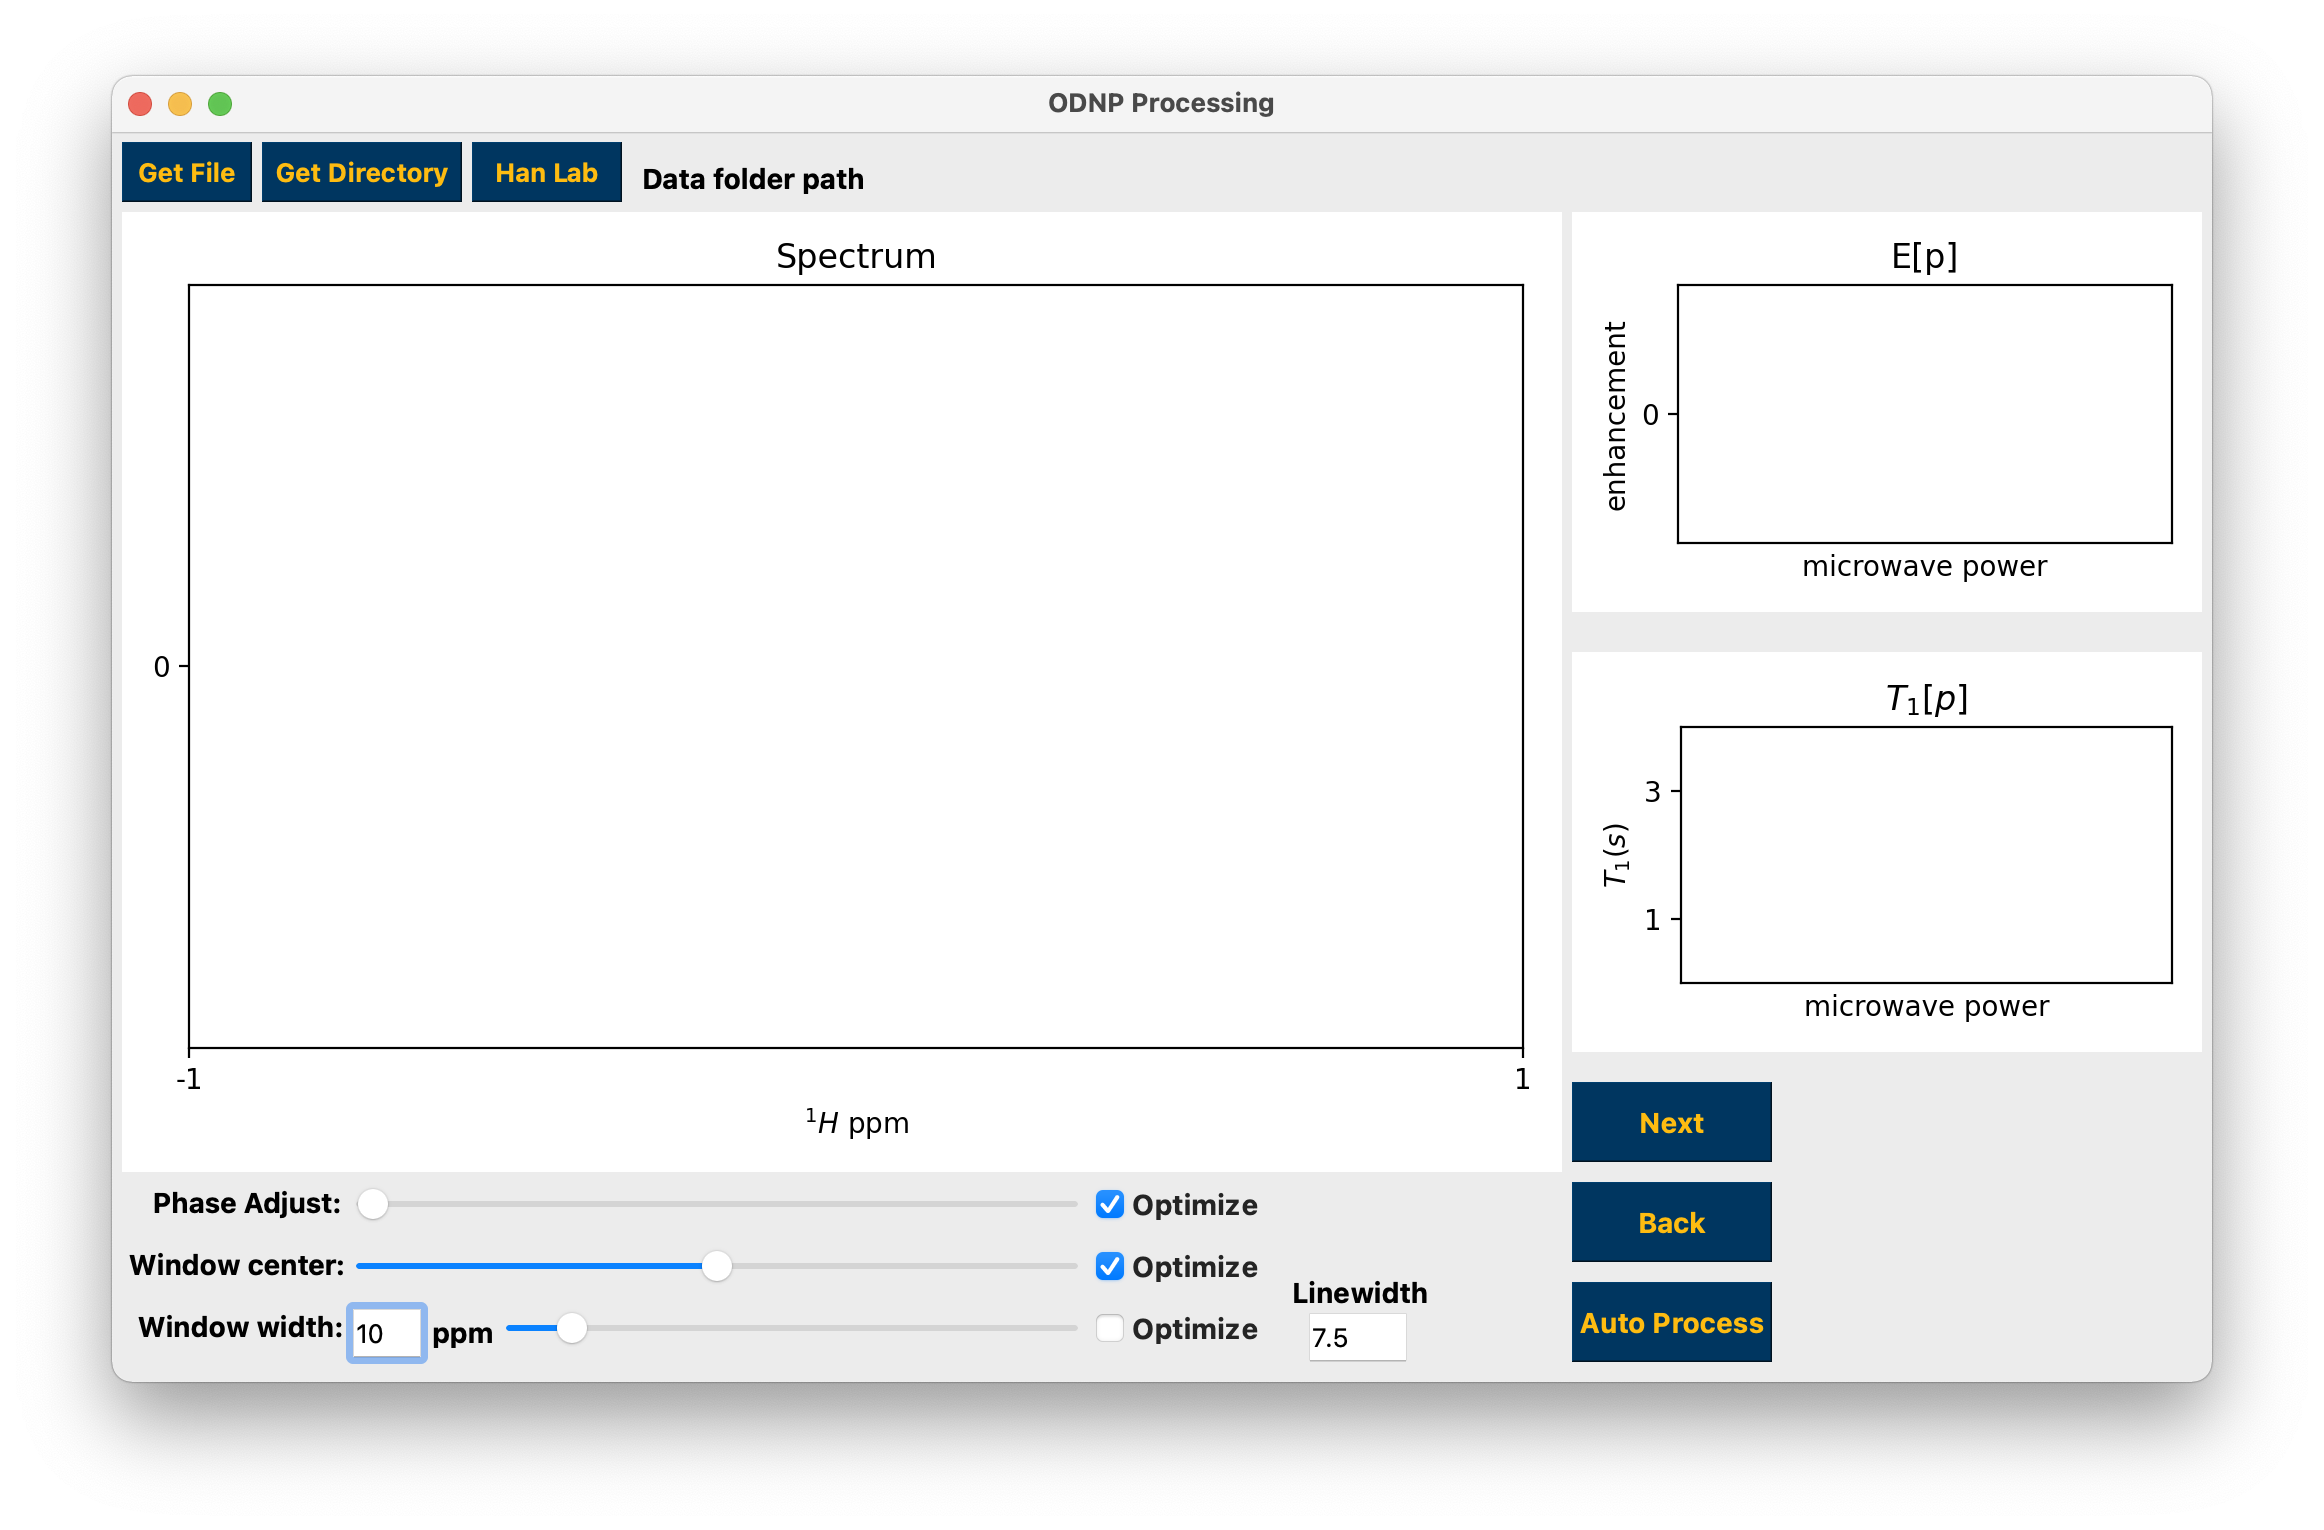
To work on a single topspin spectrum use the Get Directory button to select a numbered folder containing a single spectrum, either 1D or 2D. You may make adjustments to the data phase and integration window using the sliders and edit box or the windowing linewidth using the edit box. Use the “Optimize” checkboxes to search for and apply the “optimal” parameters. For inversion recovery experiments the yellow markers in the top right hand plot are the imaginary parts of the integrals. The optimal integration window parameters and phase should result in all of these points occurring close to 0. See hydration for the T1 fit function.
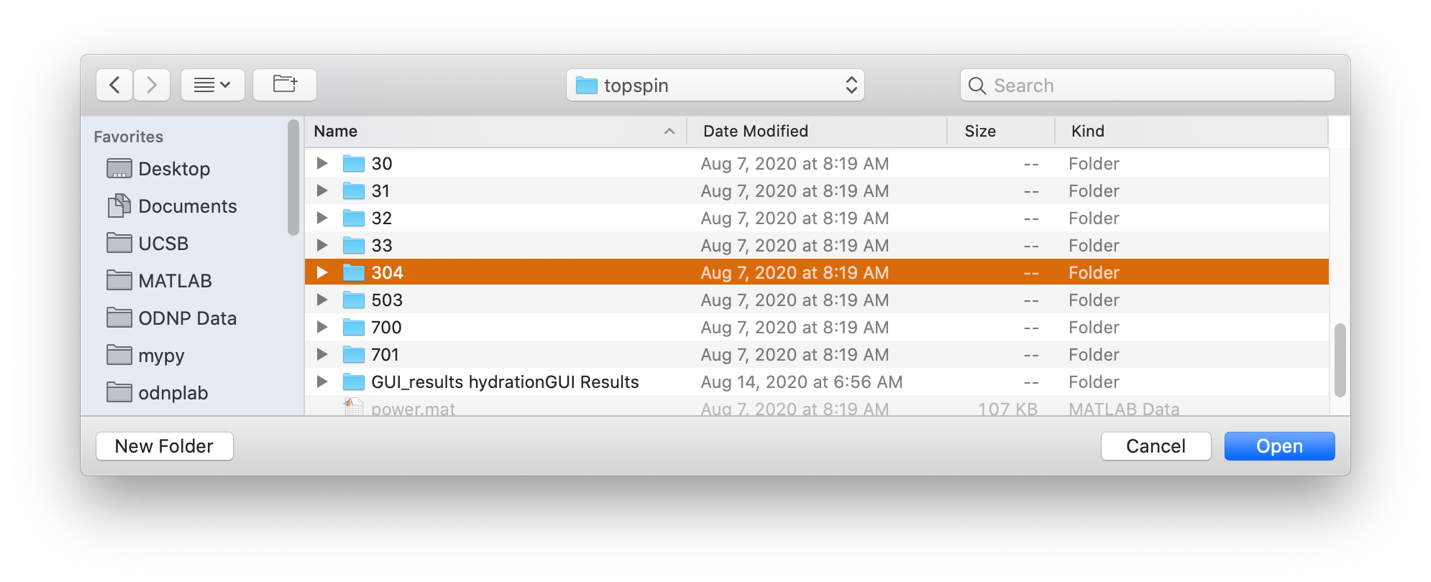
Selecting data folder
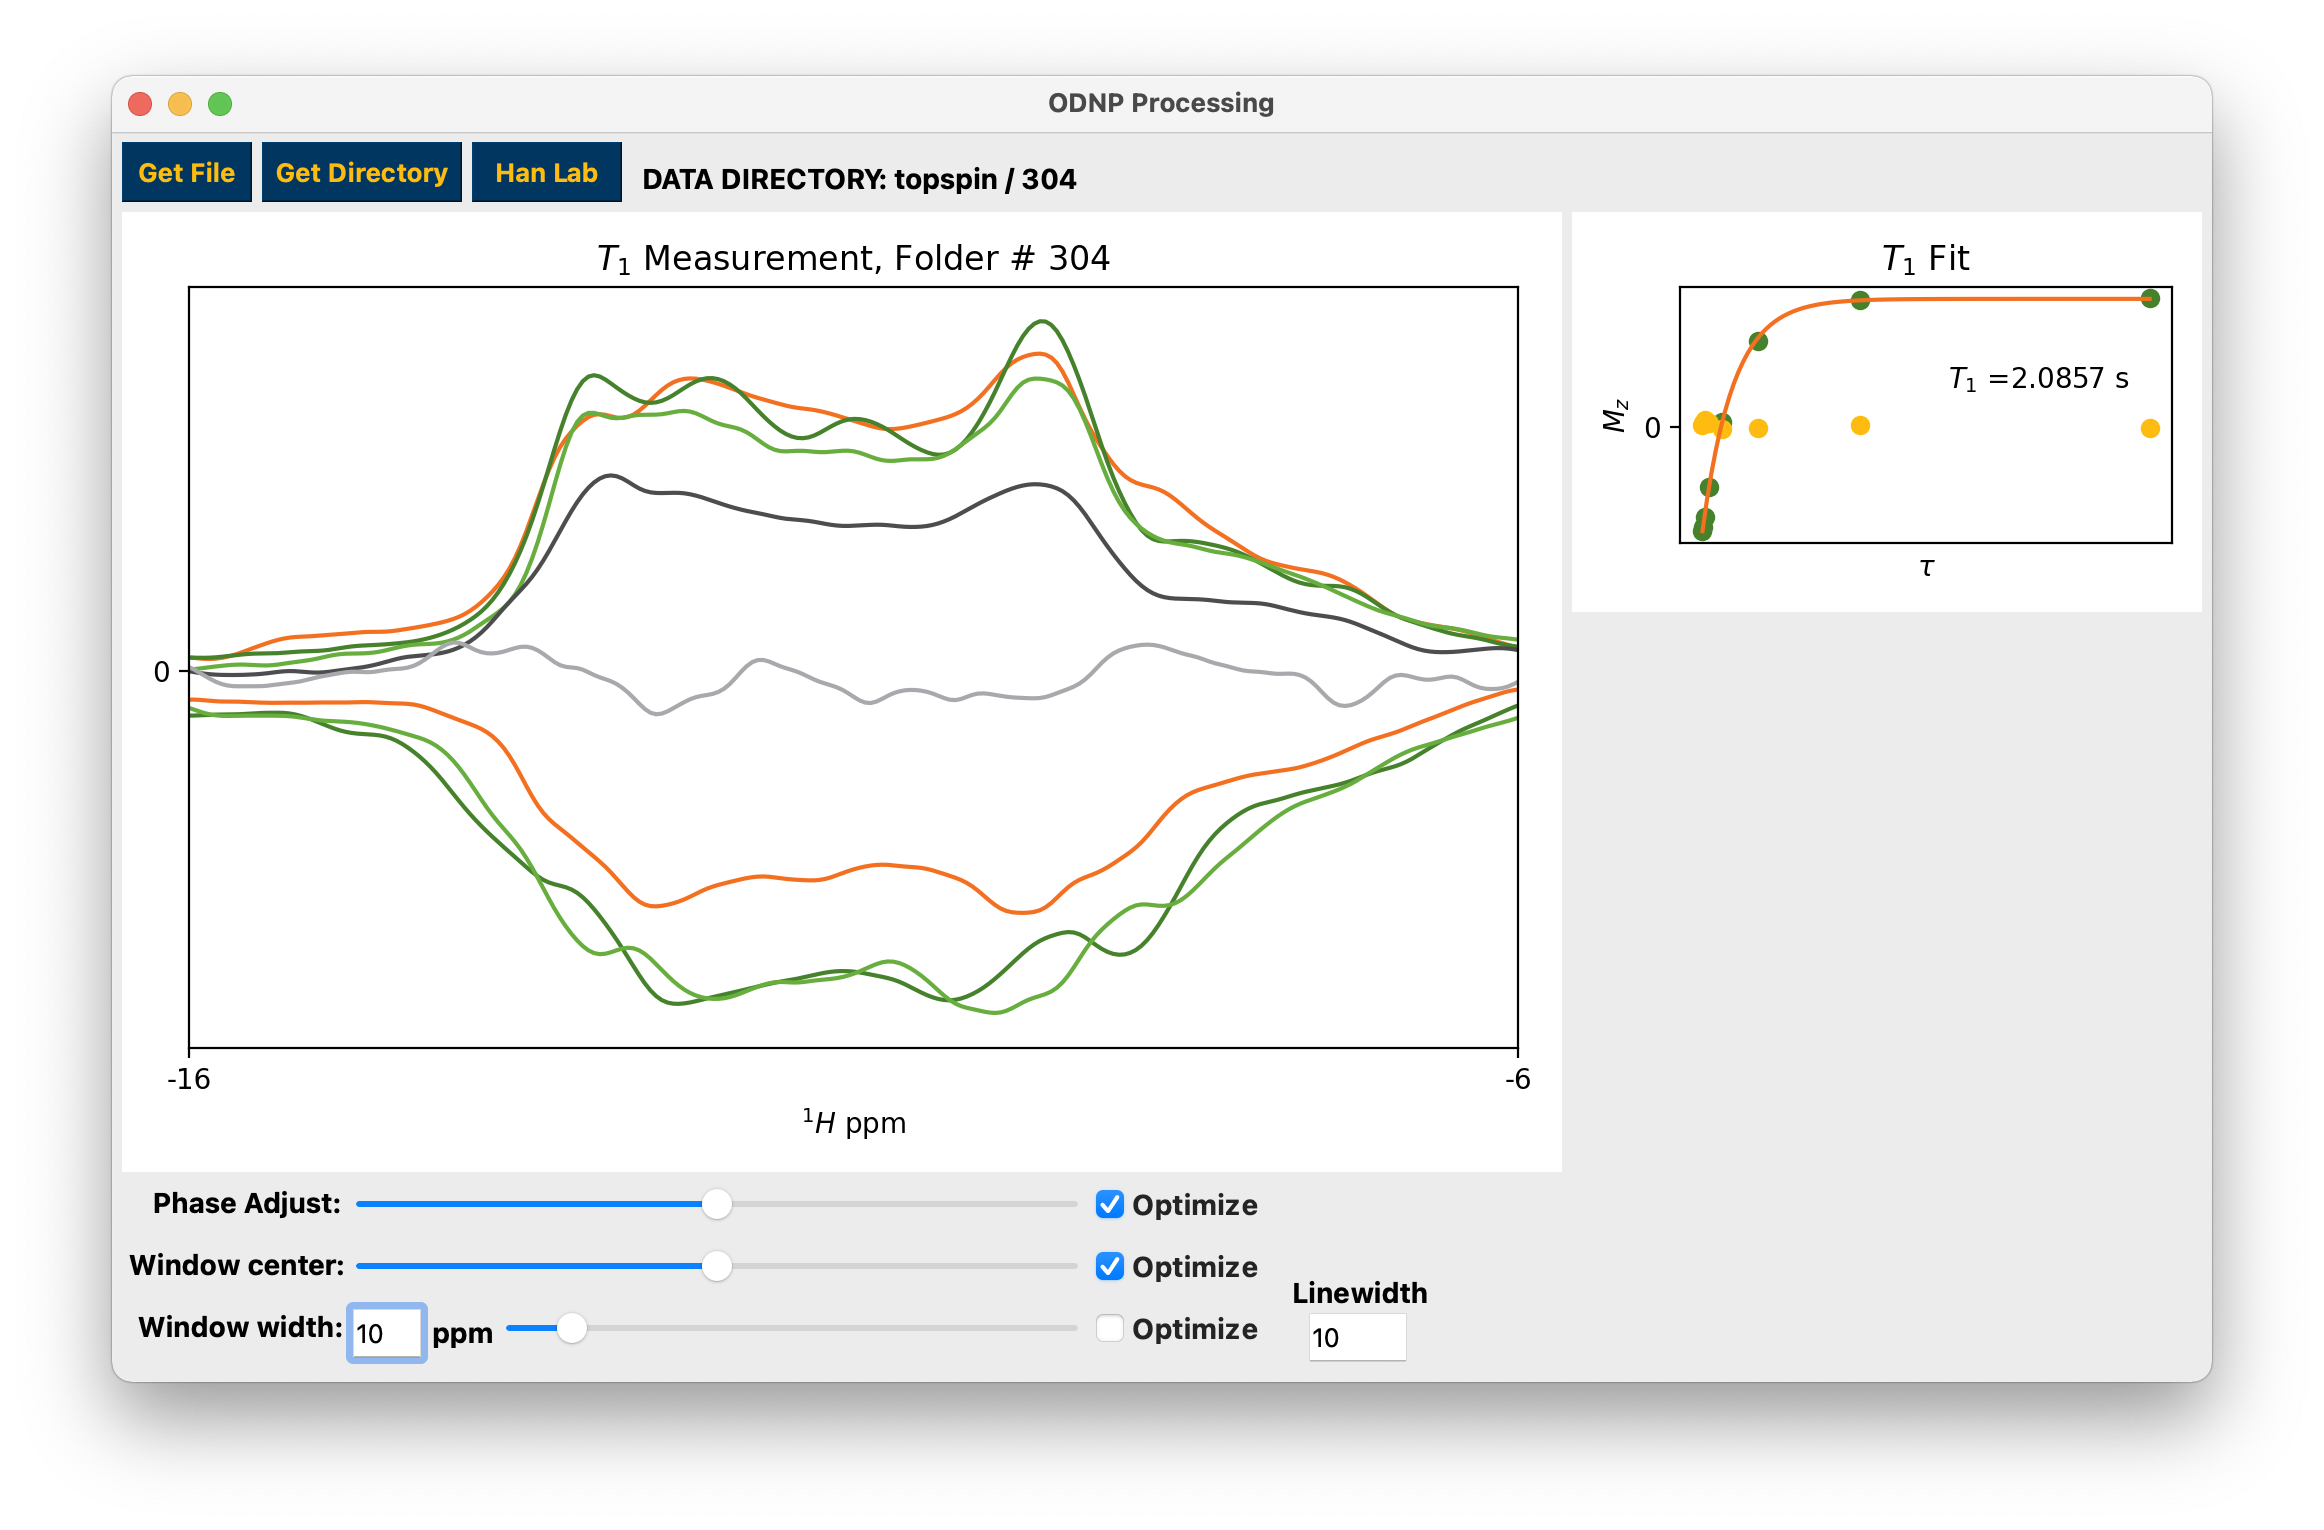
Example processing and fitting 2D inversion recovery experiment
Processing Han lab datasets
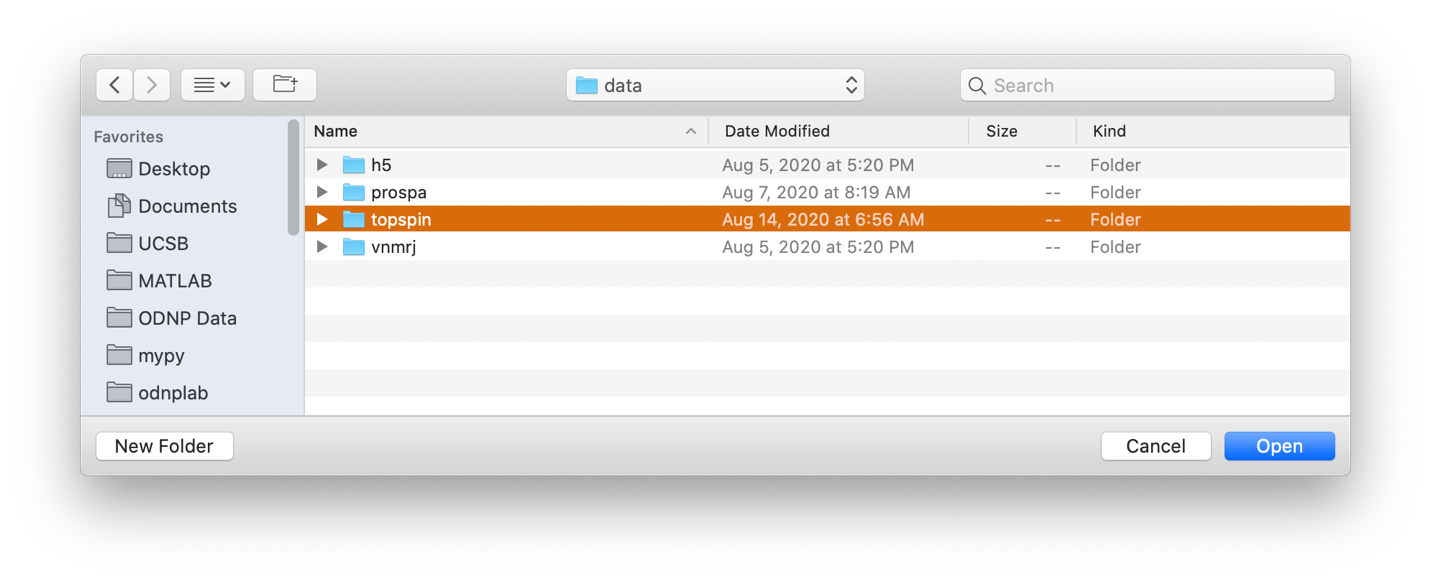
To load a dataset collected in the CNSI facility at University of California Santa Barbara using the ‘rb_dnp1’ command, use the Han Lab button and select the base folder. The folder must have at least the elements:
Folder/File |
Type |
Description |
5 |
Folder: 1D, FID |
Spectrum at microwave power = 0 |
6-26 |
Folder: 1D, FID |
FIDs collected at increasing microwave powers |
28-32 |
Folder: 2D inversion recovery |
T1 measurements collected at increasing microwave powers |
304 |
Folder: 2D inversion recovery |
T1 measurement at microwave power = 0 |
power.mat/csv |
File: MATLAB workspace or .csv |
list of power measurements made during collecting the data in folders 6-26 |
t1_powers.mat/csv |
File: MATLAB workspace or .csv |
list of power measurements made during collecting the data in folders 28-32 |
Importing "rb_dnp1" experiment
The title of the main plot will let you know which folder you are currently working on. Use the Next button to advance through the dataset towards calculating hydration parameters, and the Back button to regress through the dataset. The Auto Process button will automatically process the entire dataset and calculate hydration parameters.
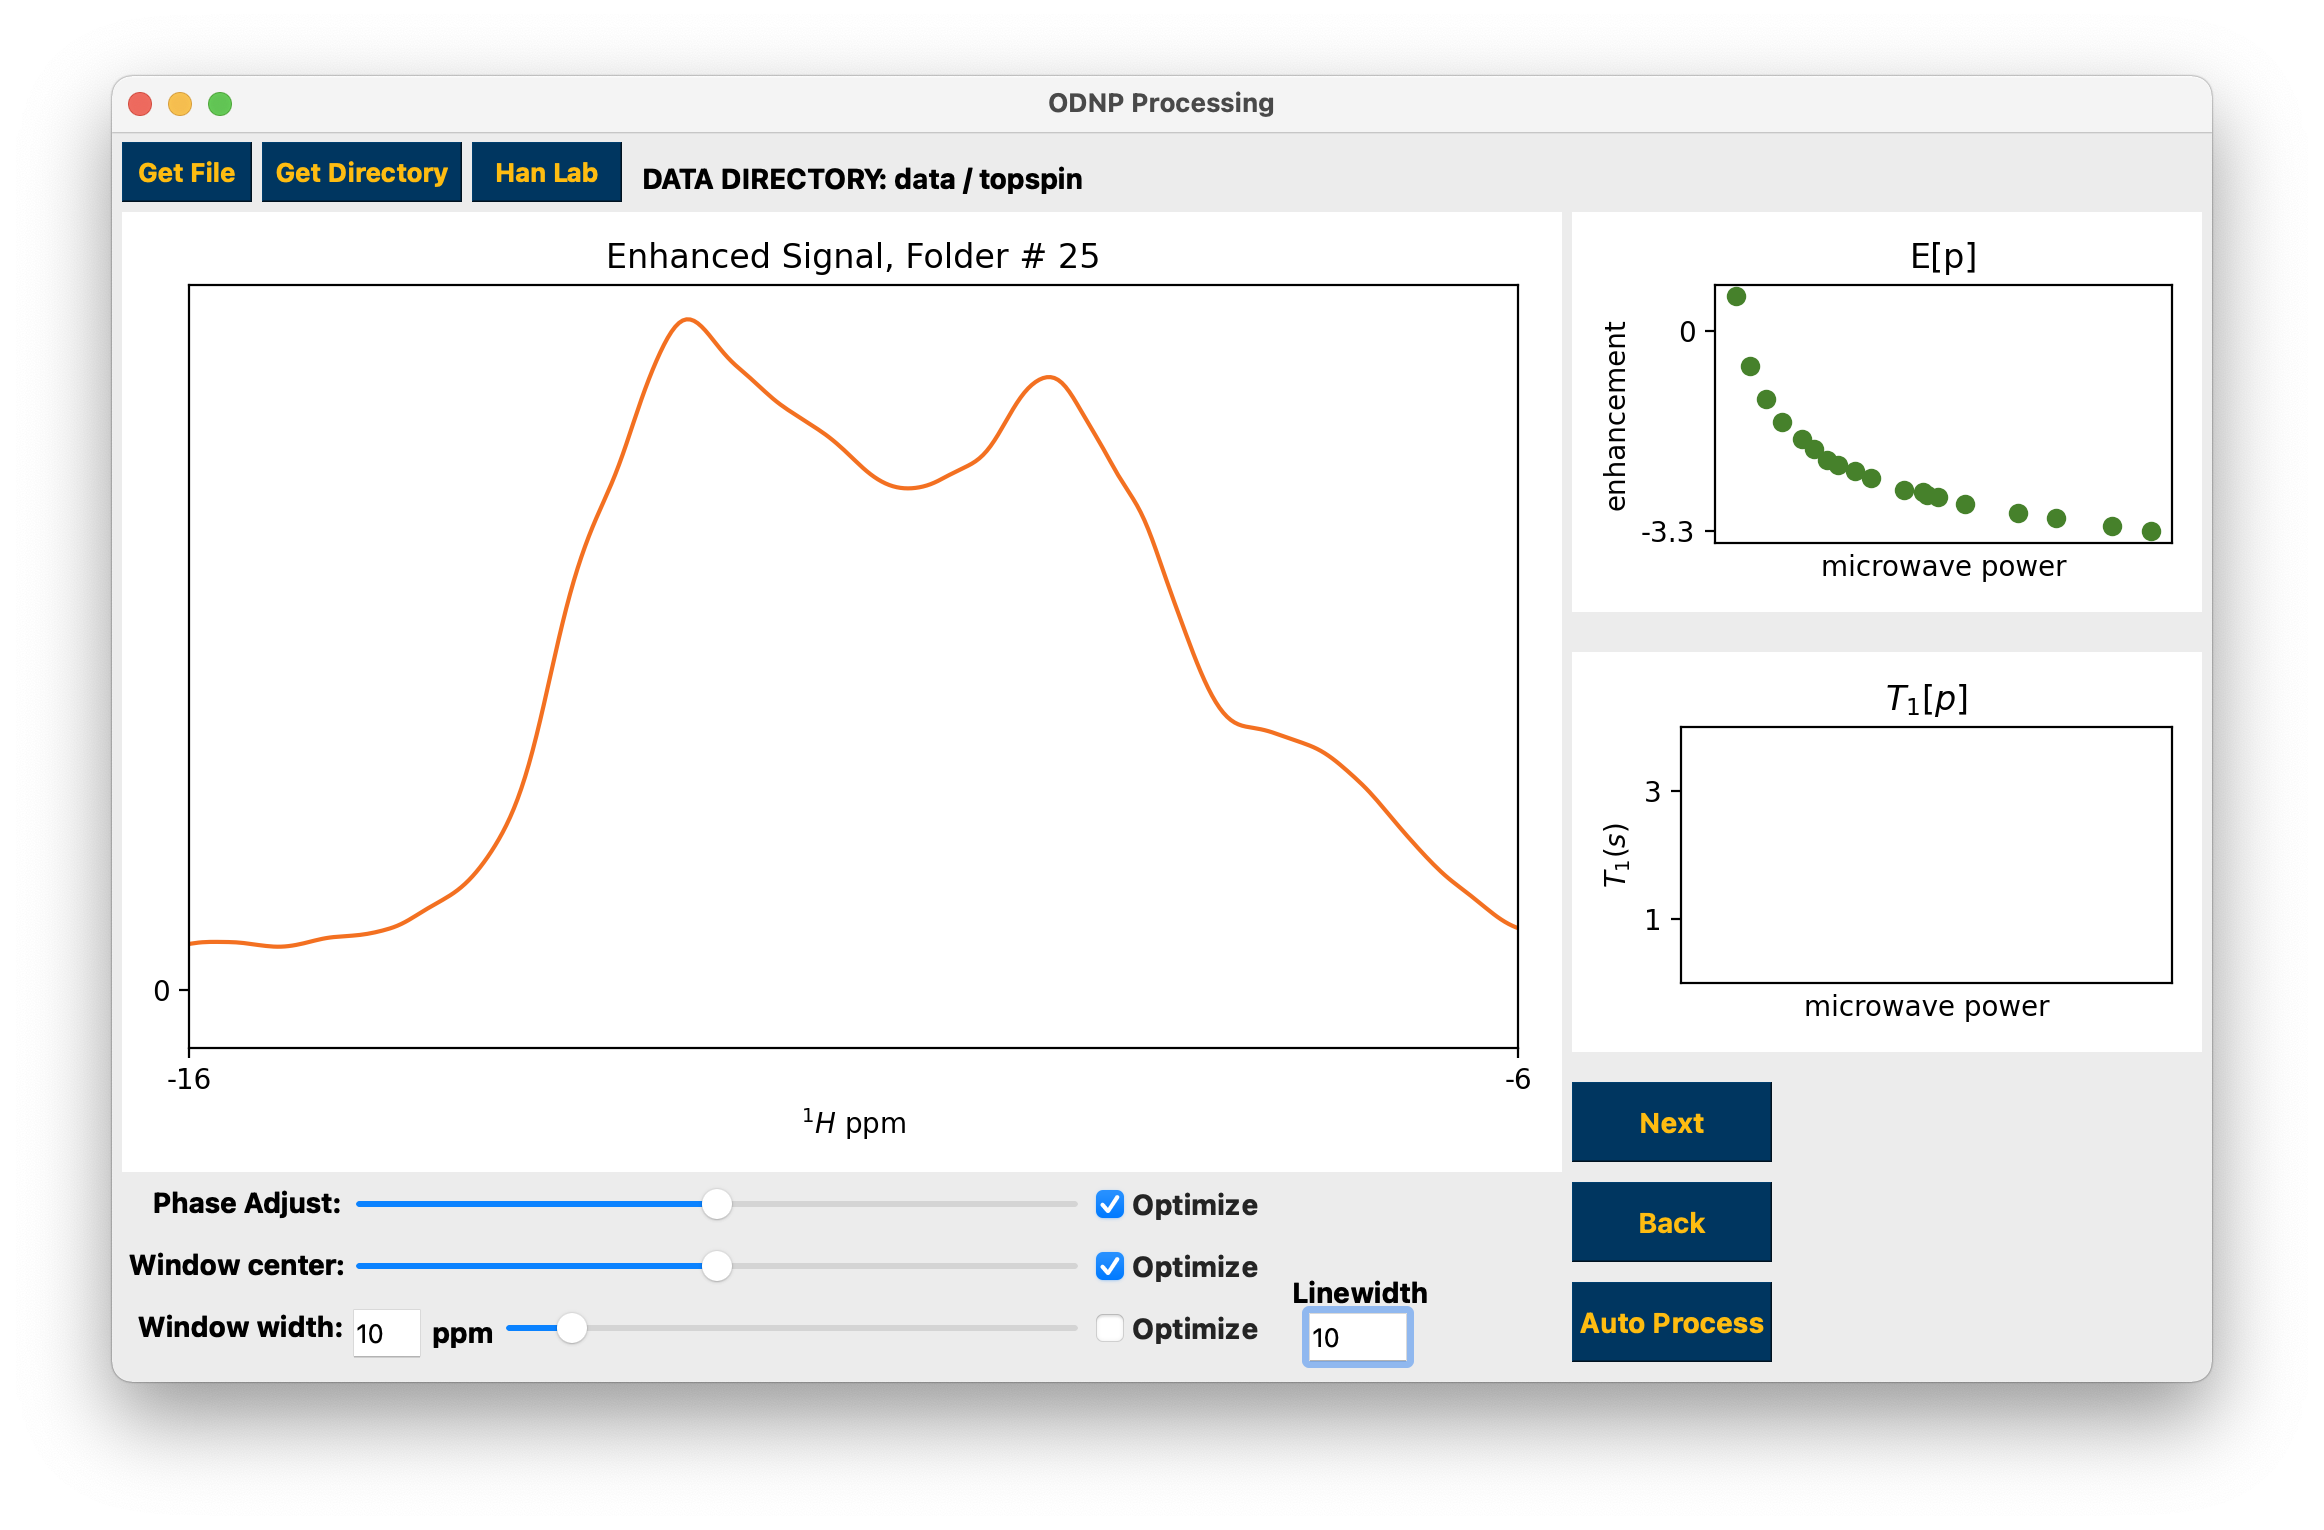
Advance through the individual datasets to process the data
You may make adjustments to the data phase, integration window width, and integration window center using the sliders and window width edit box. Use the “Optimize” checkboxes to search for and apply the “optimal” parameters. For optimizing the width, checking Optimize selects the window that encompasses roughly 2/3 of the peak area while unchecking selects the default width of 10 ppm. For NMR at ~15MHz, 10 ppm corresponds to ~150MHz, which is a typical peak width for data collected at CNSI. If processing data collected at CNSI it is recommended you use the default 10 ppm window width. Regardless of the chosen width, it is always recommended that you be consistent to ensure comparability between data. When the Next or Auto Process buttons are pressed the width that is displayed in the plot will be used for integration.
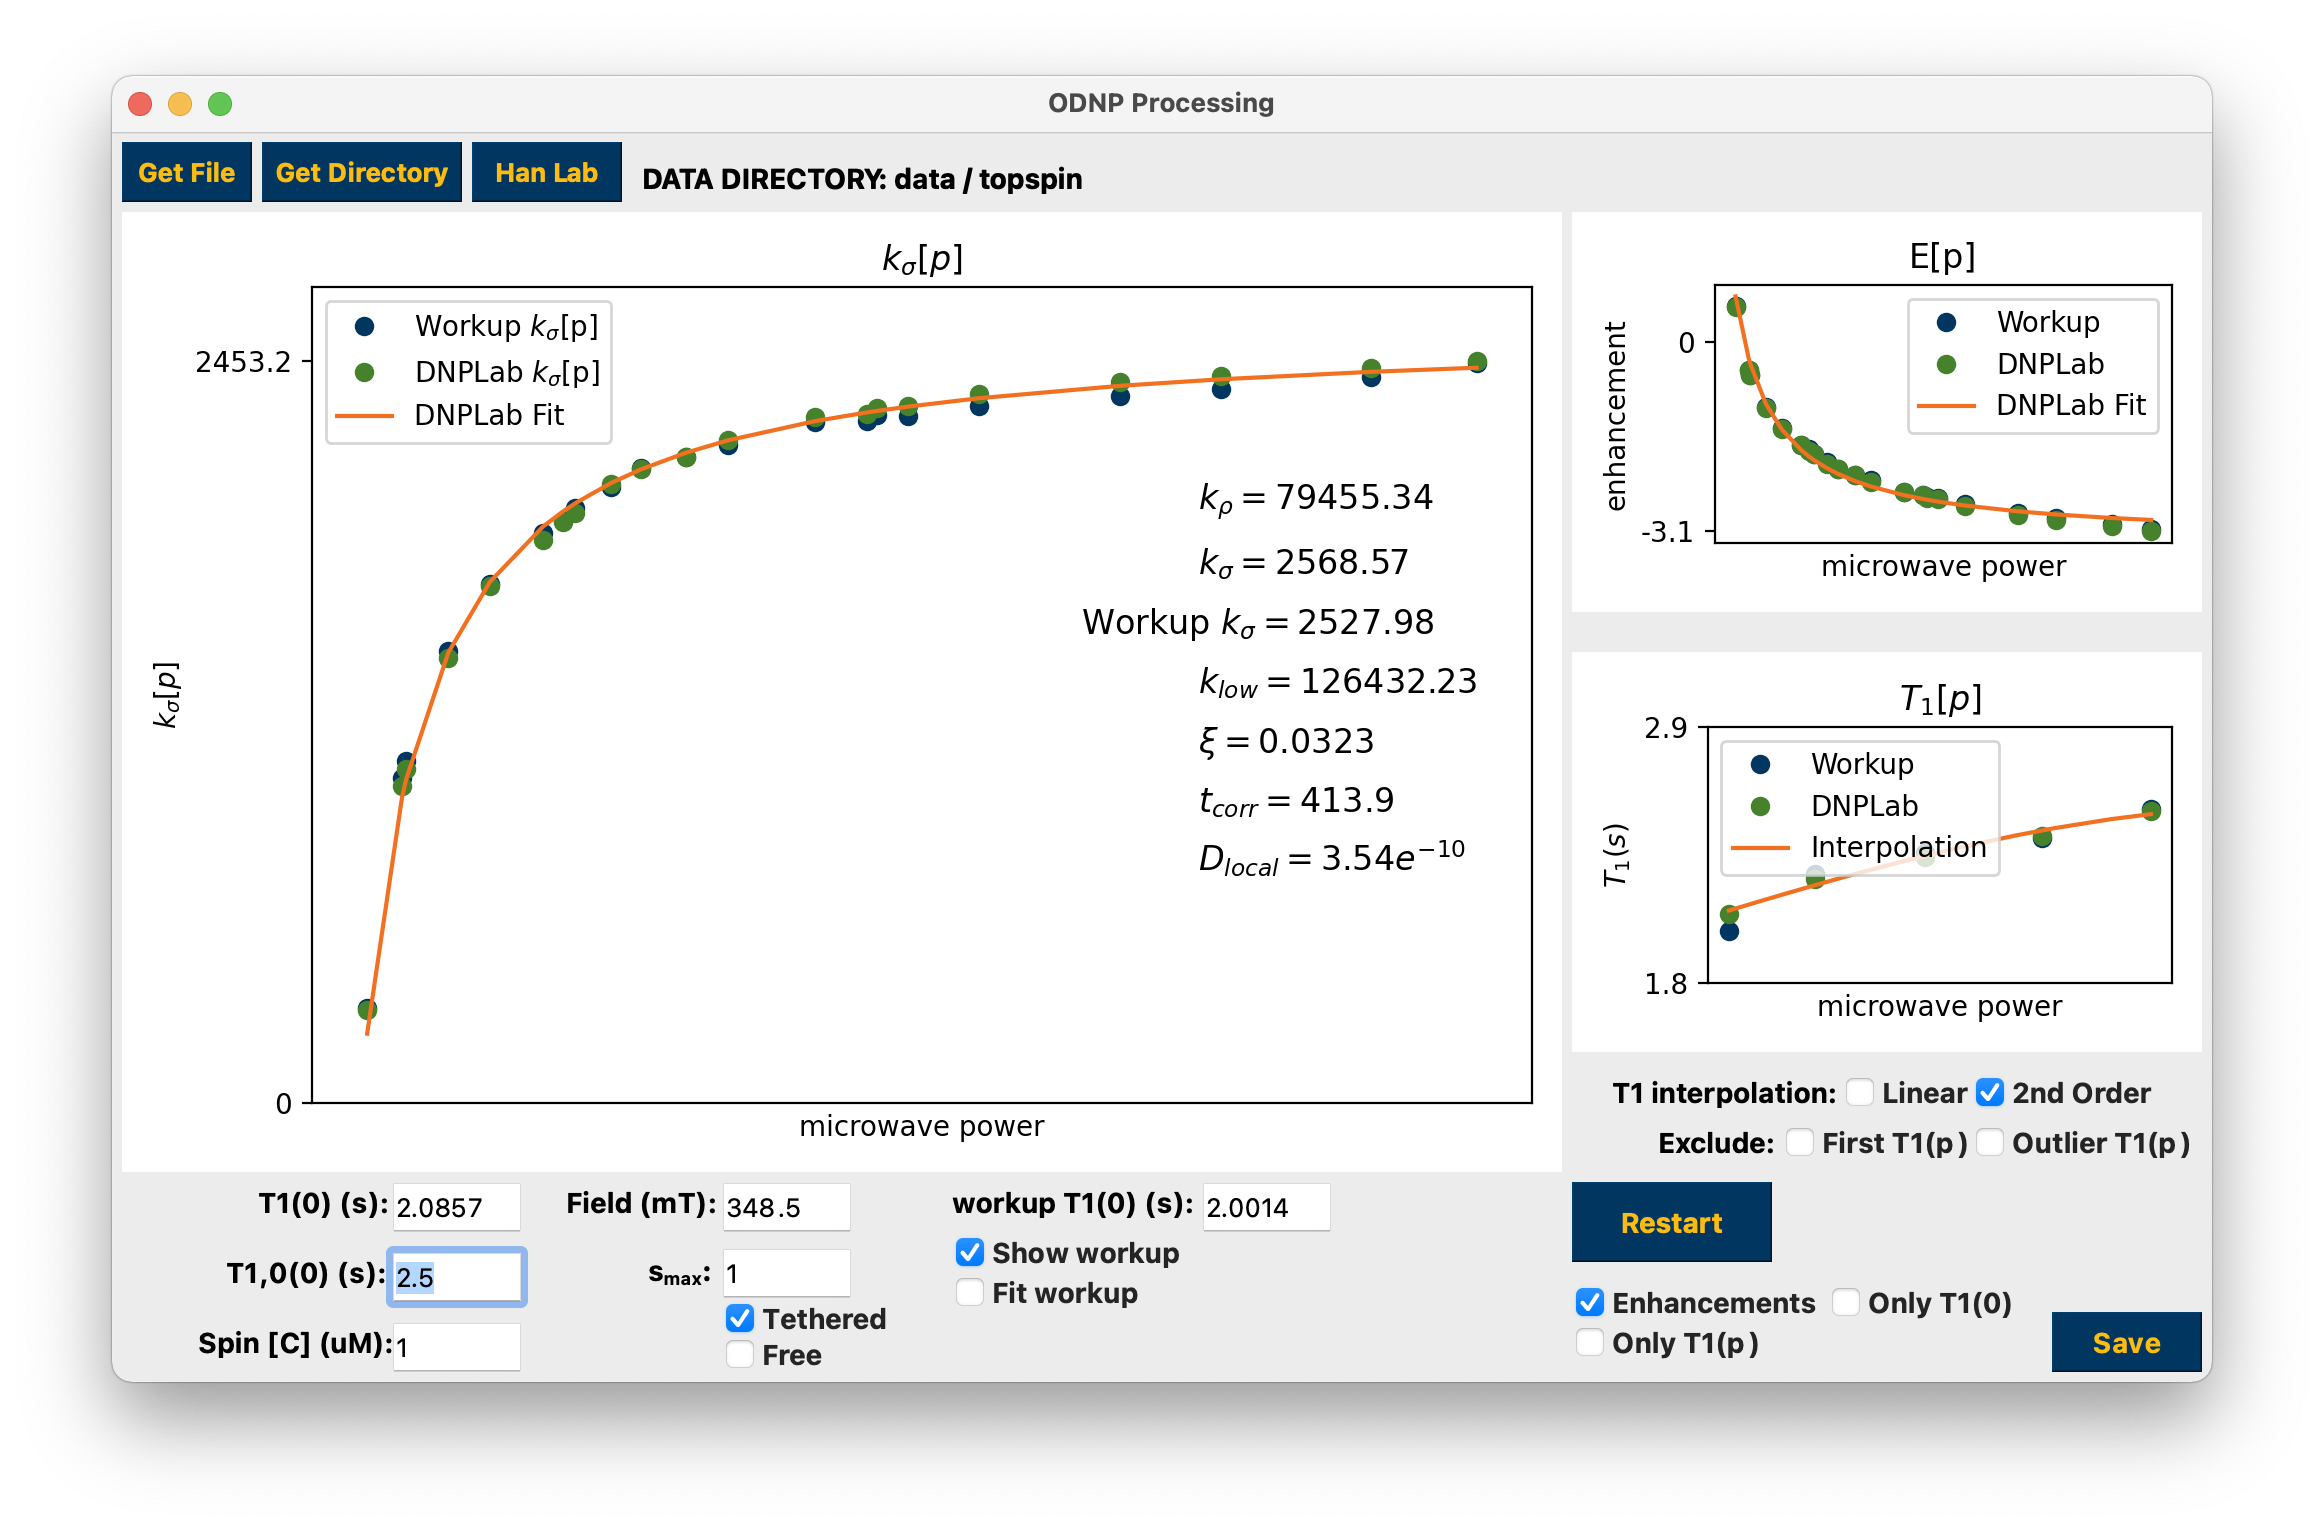
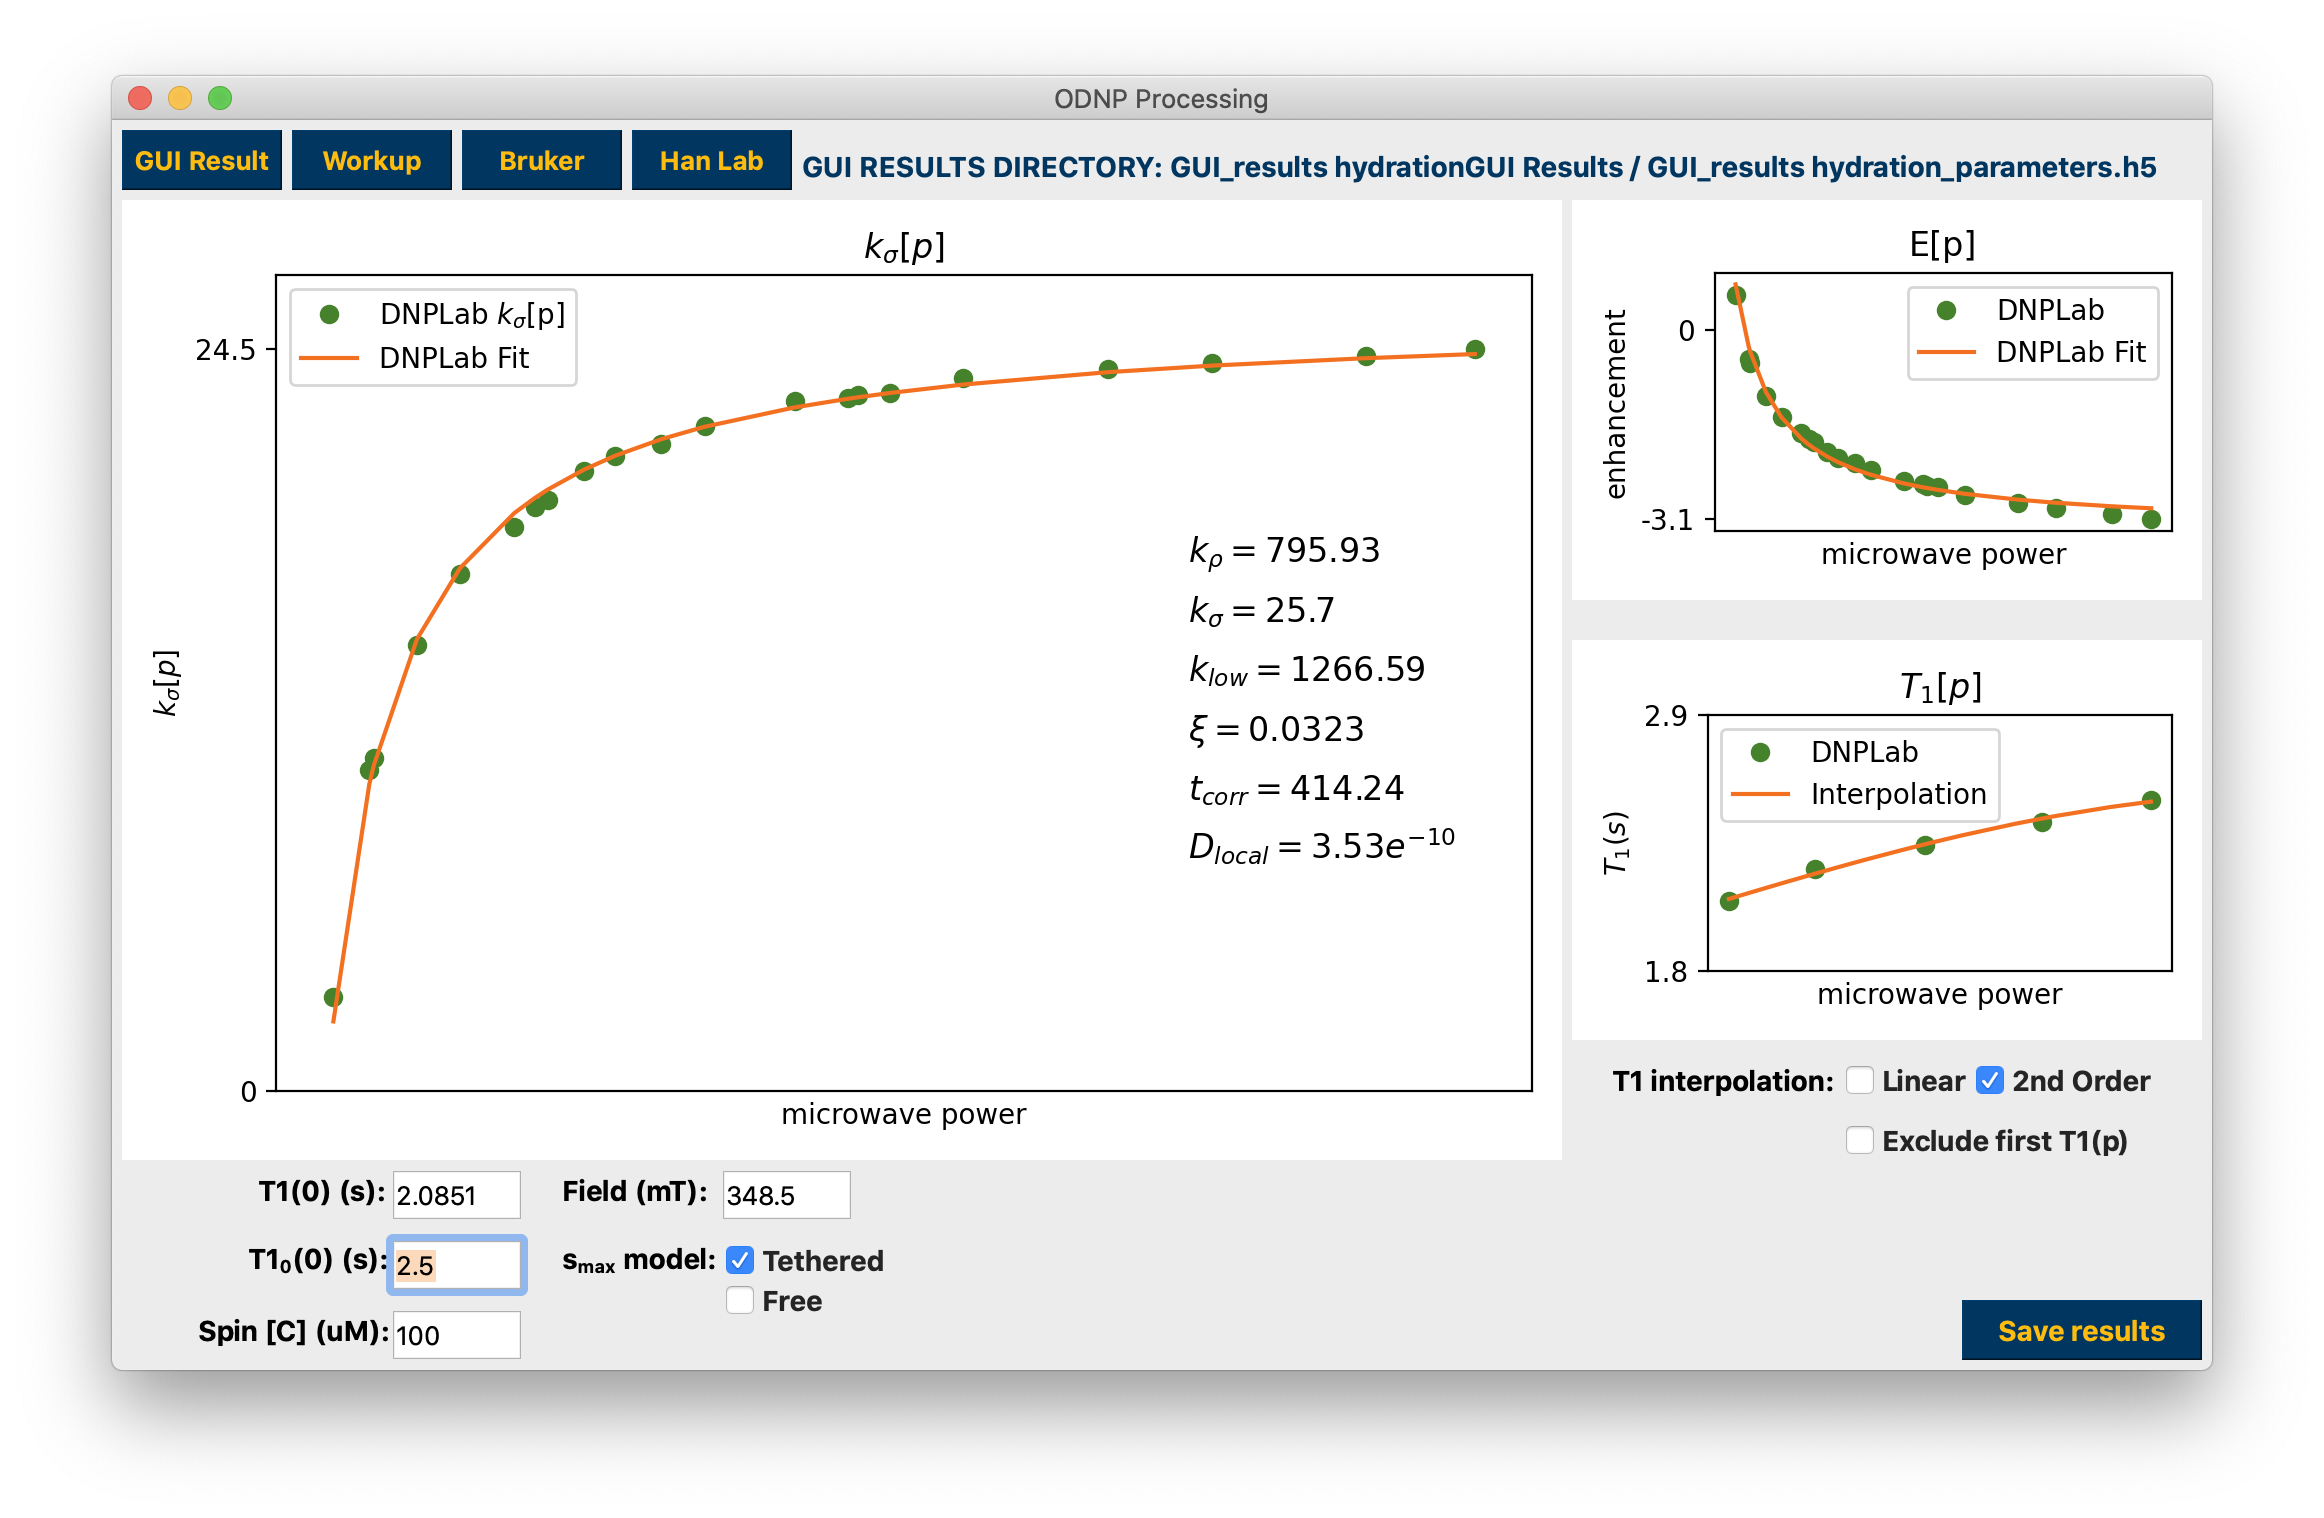
Presentation of dnpHydration results
The results are displayed when finished. If a “Workup” is also present in the data folder it will be imported for comparison. Use the corresponding checkboxes to interact with the Workup results. Interaction with any parameter edit field or checkbox, as well as the T1 interpolation checkboxes, automatically updates the calculations. Click hydration to see how the data are arranged by the GUI and used to calculate hydration parameters.
The Restart button will return you to the beginning of processing. If the Only T1(0) checkbox is selected, Restart will return you to the final folder that is the T1 (0) measurement while all other processing will be retained. If the Only T1(p) checkbox is selected you will return to the beginning of the series of T1 measurements and previous processing of the enhancement points is retained.
Analyzing Workup results or previously saved GUI results
You may also load and analyze the results of “Workup” code processing with the Get Directory button, or you may select the .mat or .h5 files of a previously saved hydrationGUI session with the Get File button. The Workup folder must have at least the following elements:
Filename |
File type |
File contains |
enhancementPowers.csv |
.csv file |
list of enhancements and corresponding power measurements |
kSigma.csv |
.csv file |
list of [spin_concentration * κσ * s(p)] values. |
t1Powers.csv |
.csv file |
list of T1 s and corresponding power measurements |
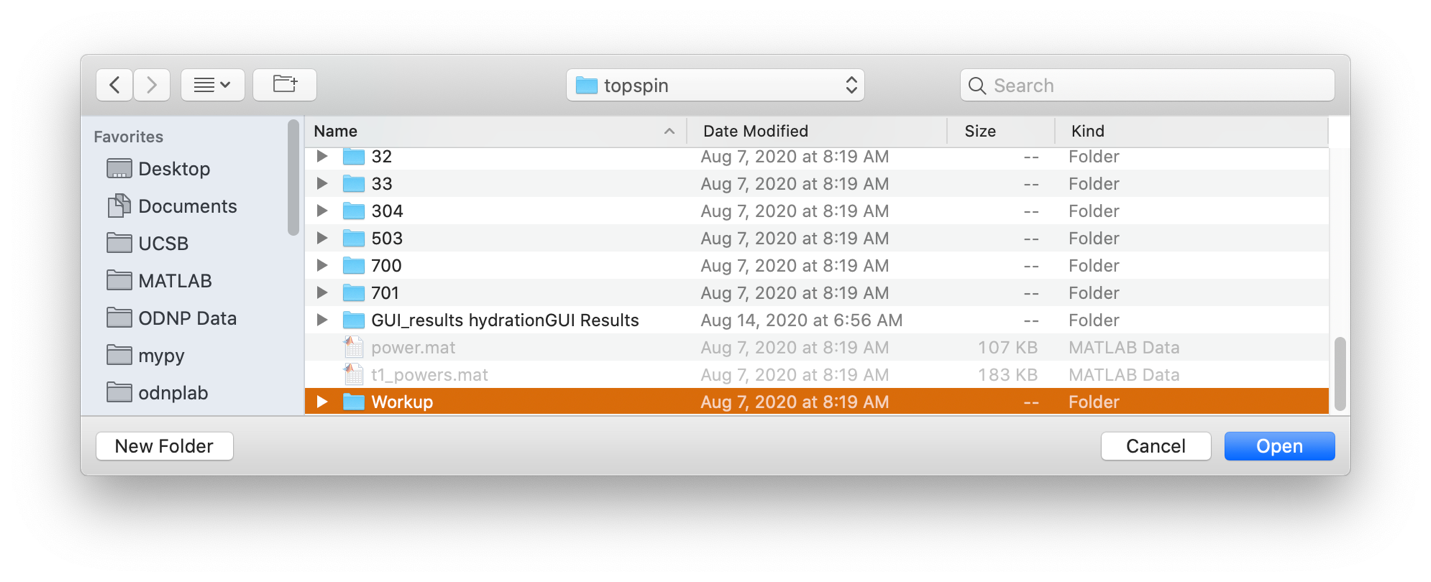
Select a Workup folder
If the mat workspace or h5 file were not saved from hydrationGUI, they can still be read and analyzed if they have the same elements.
The mat workspace must contain a structure named "odnp" with at least the following elements (the same structure accepted and saved by the MATLAB App called xODNP, available at MathWorks File Exchange https://www.mathworks.com/matlabcentral/fileexchange/73293-xodnp):
Variable |
Type |
Description |
odnp.Ep |
#x1 Double |
list of signal enhancements |
odnp.Epowers |
#x1 Double |
list of powers used to collect Ep |
odnp.T1p |
#x1 Double |
list of T1 values |
odnp.T1p_stdd |
#x1 Double |
list of standard deviations in T1p |
odnp.T1powers |
#x1 Double |
list of powers used to collect T1p |
odnp.T10 |
single number |
T1 value for power = 0, i.e. T1 (0) |
odnp.T10_stdd |
single number |
standard deviation in T10 |
odnp.T100 |
single number |
T1,0 (0) |
odnp.T100_stdd |
single number |
standard deviation in T100 |
The h5 must contain a dictionary named 'hydration_inputs' with at least the following elements:
Key |
Type |
Description |
E |
numpy array |
list of signal enhancements |
E_power |
numpy array |
list of powers used to collect Ep |
T1 |
numpy array |
list of T1 values |
T1_power |
numpy array |
list of powers used to collect T1p |
T10 |
float |
T1 value for power = 0, i.e. T1 (0) |
T100 |
float |
T1,0 (0) |
and a separate dictionary named 'hydration_results' with at least the following elements:
Key |
Type |
Description |
T1_stdd |
numpy array |
list of standard deviations in T1 |
T10_stdd |
float |
standard deviation in T10 |
T100_stdd |
float |
standard deviation in T100 |
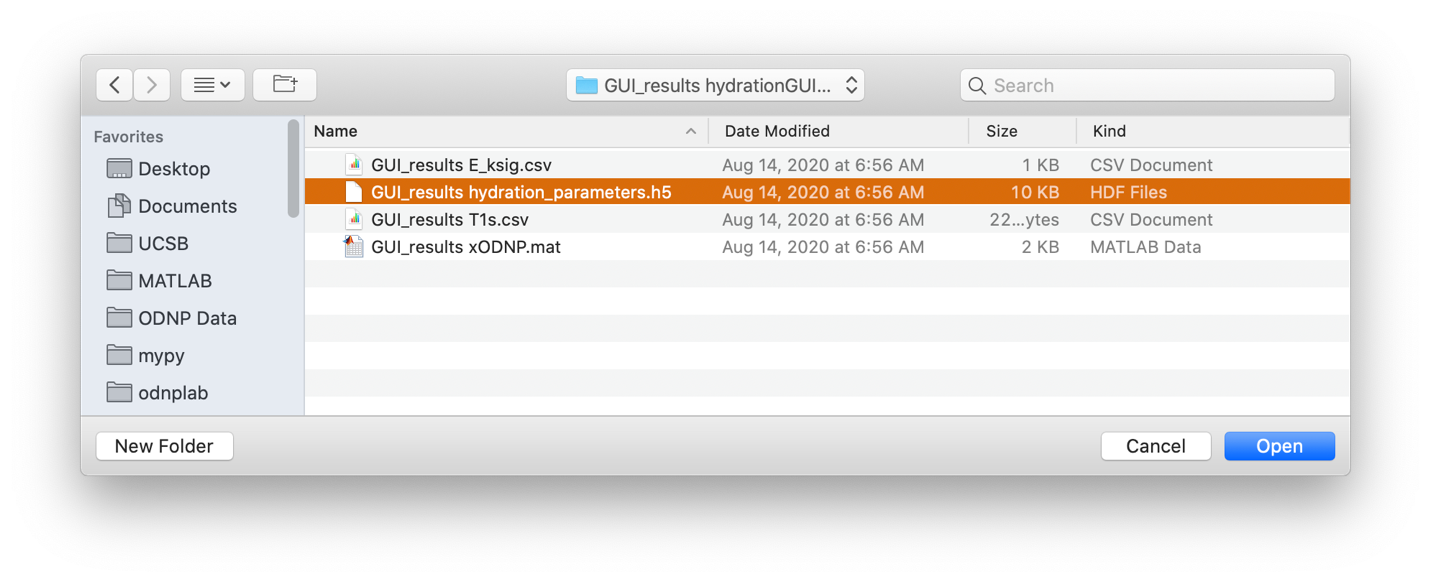
Select a saved mat or h5 file
The results of previous processing will be used to calculate hydration parameters.
Analyzed results from previously saved Workup, mat workspace, or h5
Terminal outputs
The terminal will display processing and calculation progress as well as standard deviations in the T1 values and κσ, including the imported κσ if a Workup was found.
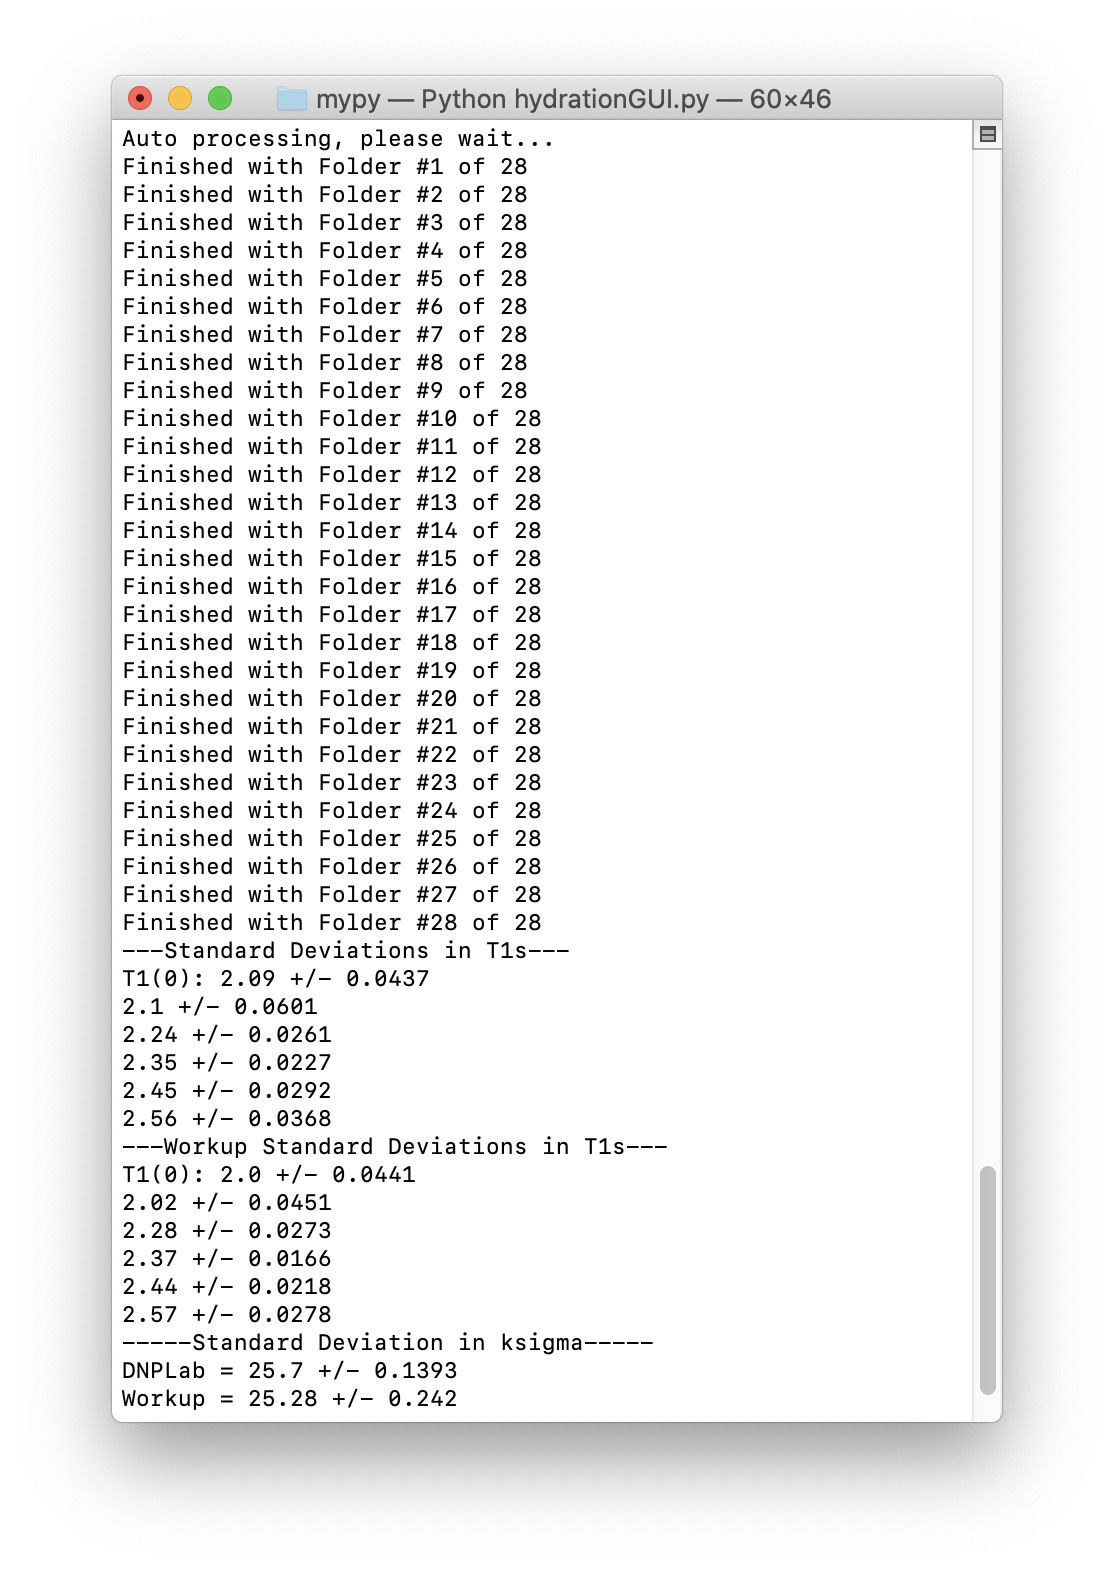
Terminal outputs during processing and calculations
Saving Results
After processing is complete and hydration parameters are calculated, the Save button is available. Your results are saved in .csv, .h5, and .mat formats. The .h5 and .mat files can be imported by hydrationGUI. The .mat file can be imported by the MATLAB app called xODNP that is available at MathWorks File Exchange: https://www.mathworks.com/matlabcentral/fileexchange/73293-xodnp. See hydration for explanation of the saved inputs/results object.